Boards & widgets
LiveDashboards
Build a board of widgets that read from your tools, the AI, or a workflow, and keep themselves up to date. Stat tiles, charts, gauges, tables, even full HTML, arranged the way you want.
What happens in this clip
- The Weather board opens in edit mode.
- A board parameter at the top is read by every card on it.
- Each widget shows where it gets its data.
- Each one carries its own refresh interval, in plain language.
- Change the parameter and every widget re-runs.
Related features
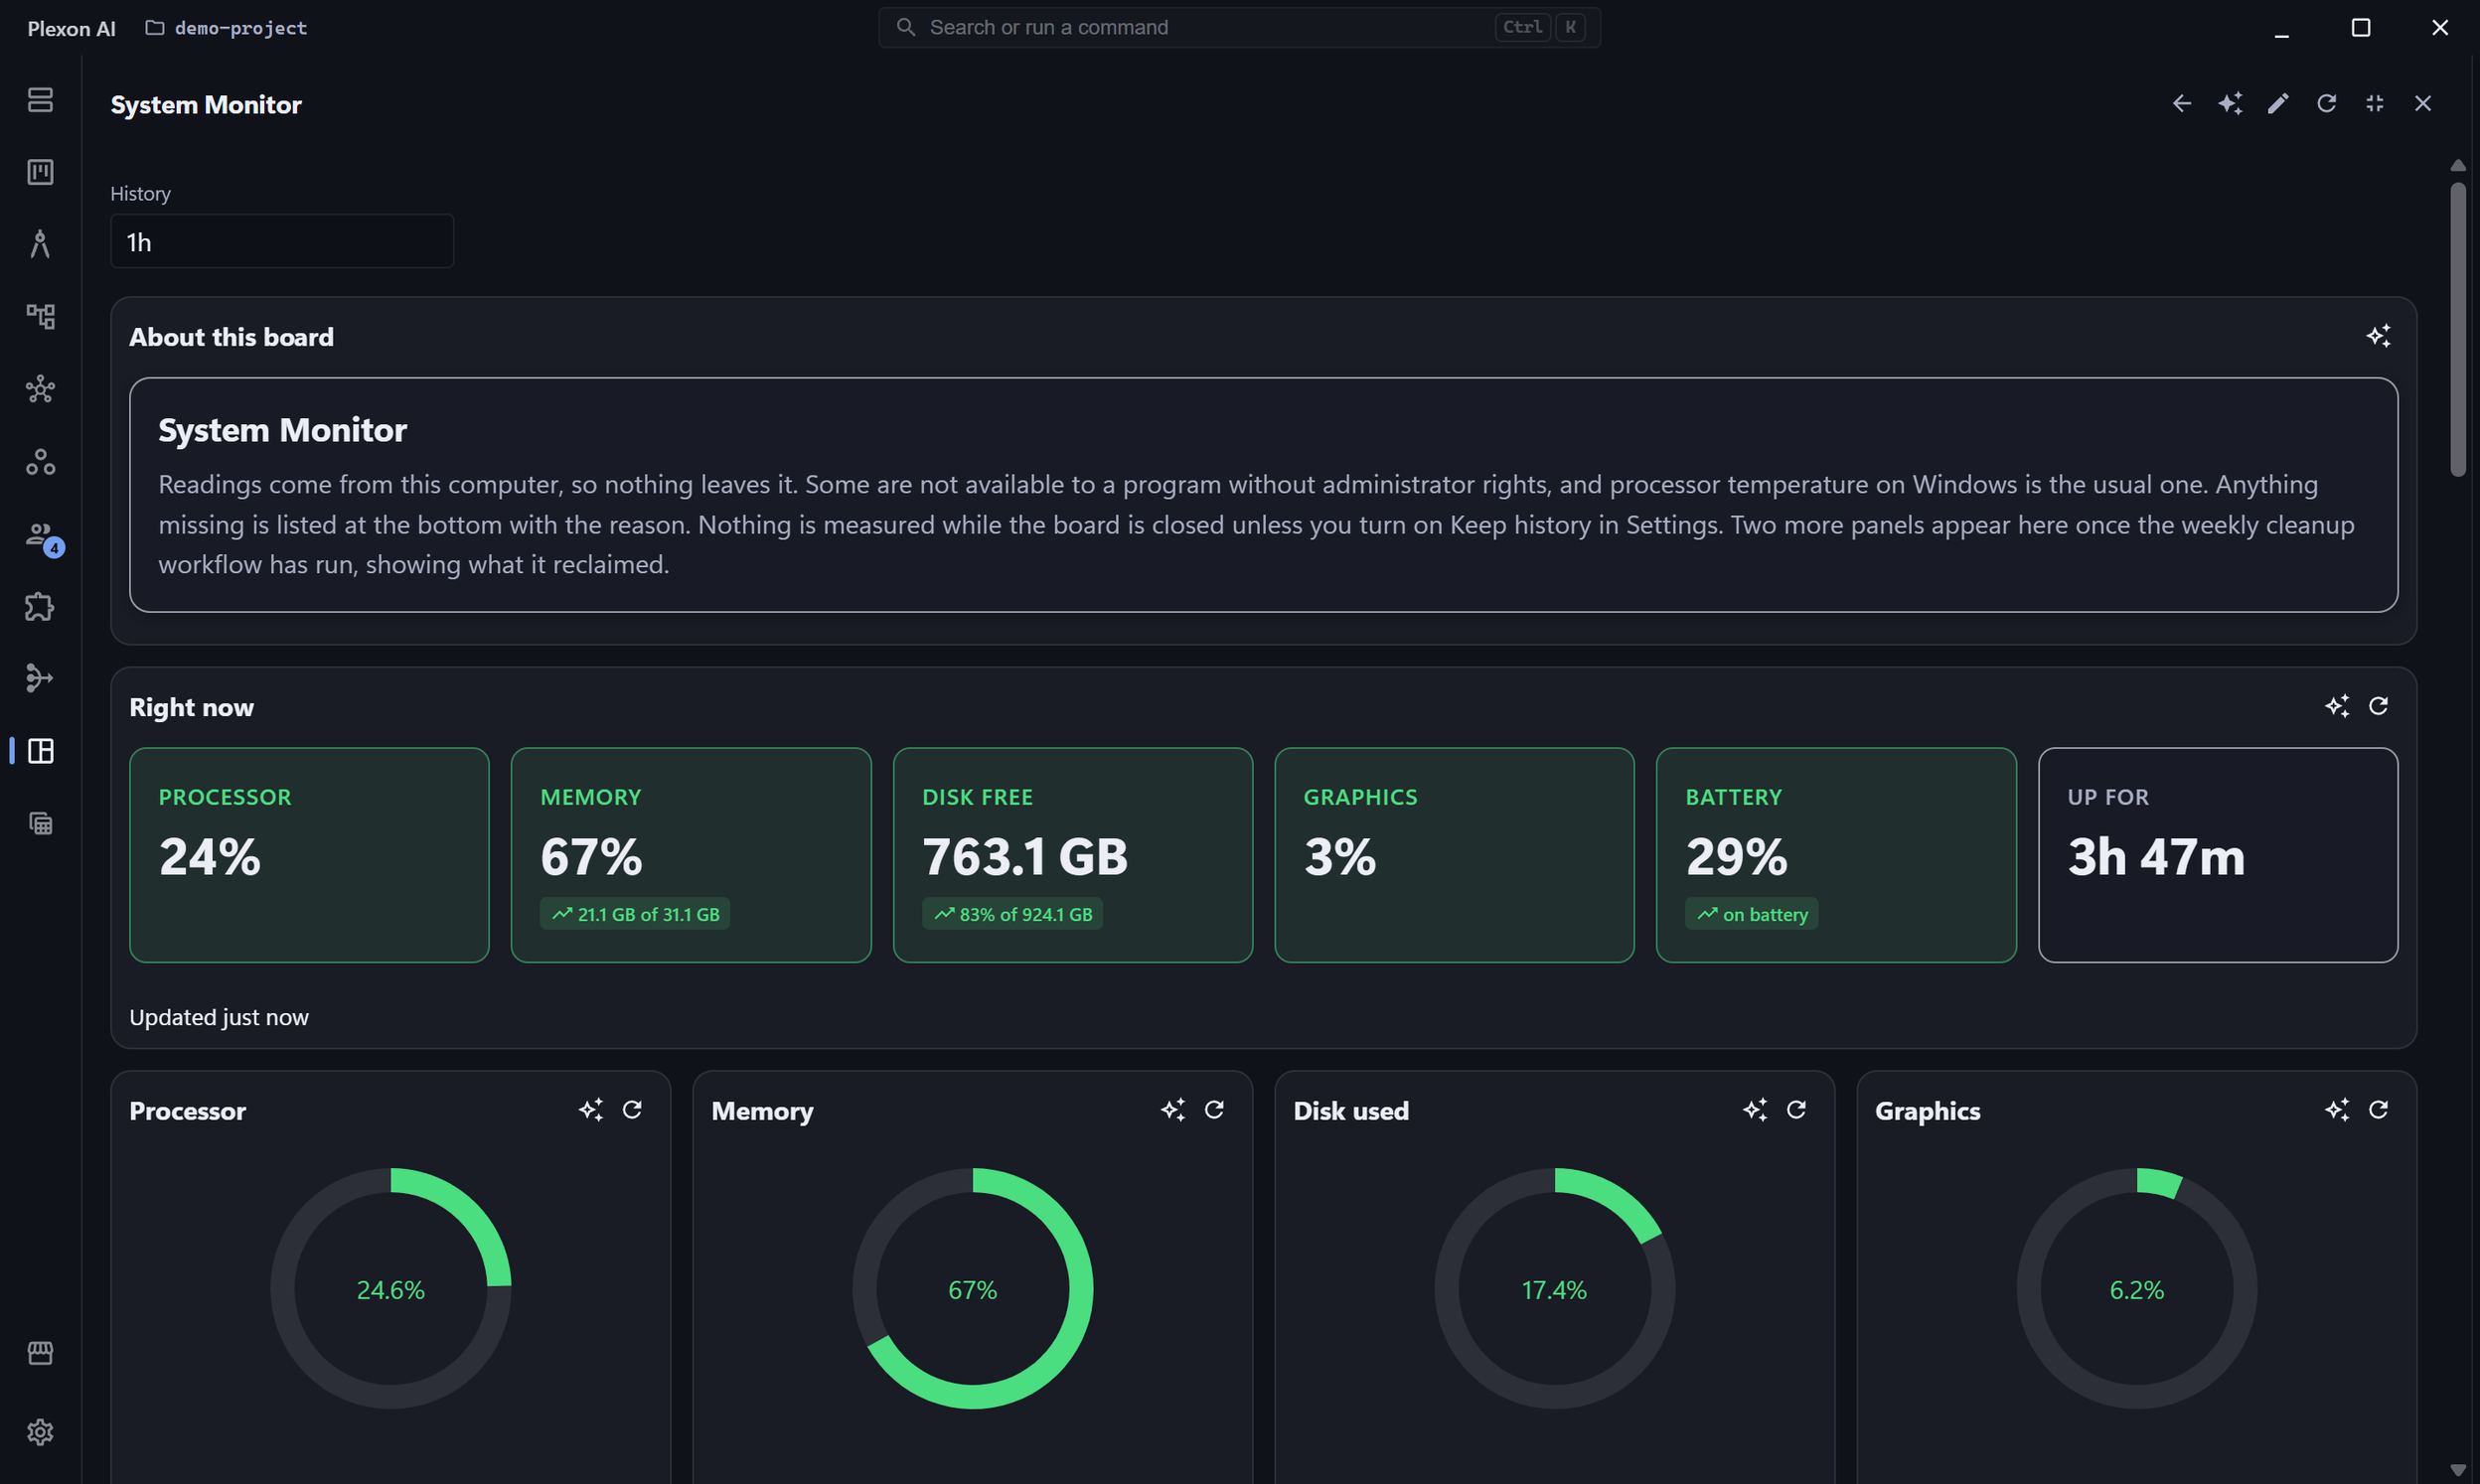
A board that reads your own machine
The bundled System Monitor board shows what this computer is doing: processor, memory, drives, graphics, temperatures, battery, and the processes using the most of each. Everything is read locally and nothing leaves the machine. A reading the operating system will not hand over, such as processor temperature on Windows, is listed with the reason rather than shown as a blank tile or a zero.
- Live tiles and gauges for processor, memory, disk and graphics, plus how long the machine has been on
- A history chart with the highest readings and the time each one happened
- Tables for drives, graphics adapters, temperatures, and the busiest processes by processor and by memory
- A panel showing what could be reclaimed from caches, and what the weekly cleanup actually freed
- Nothing is measured while the board is closed. Turn on Keep history to record overnight
- Windows, macOS and Linux, each reporting what it will and explaining what it will not
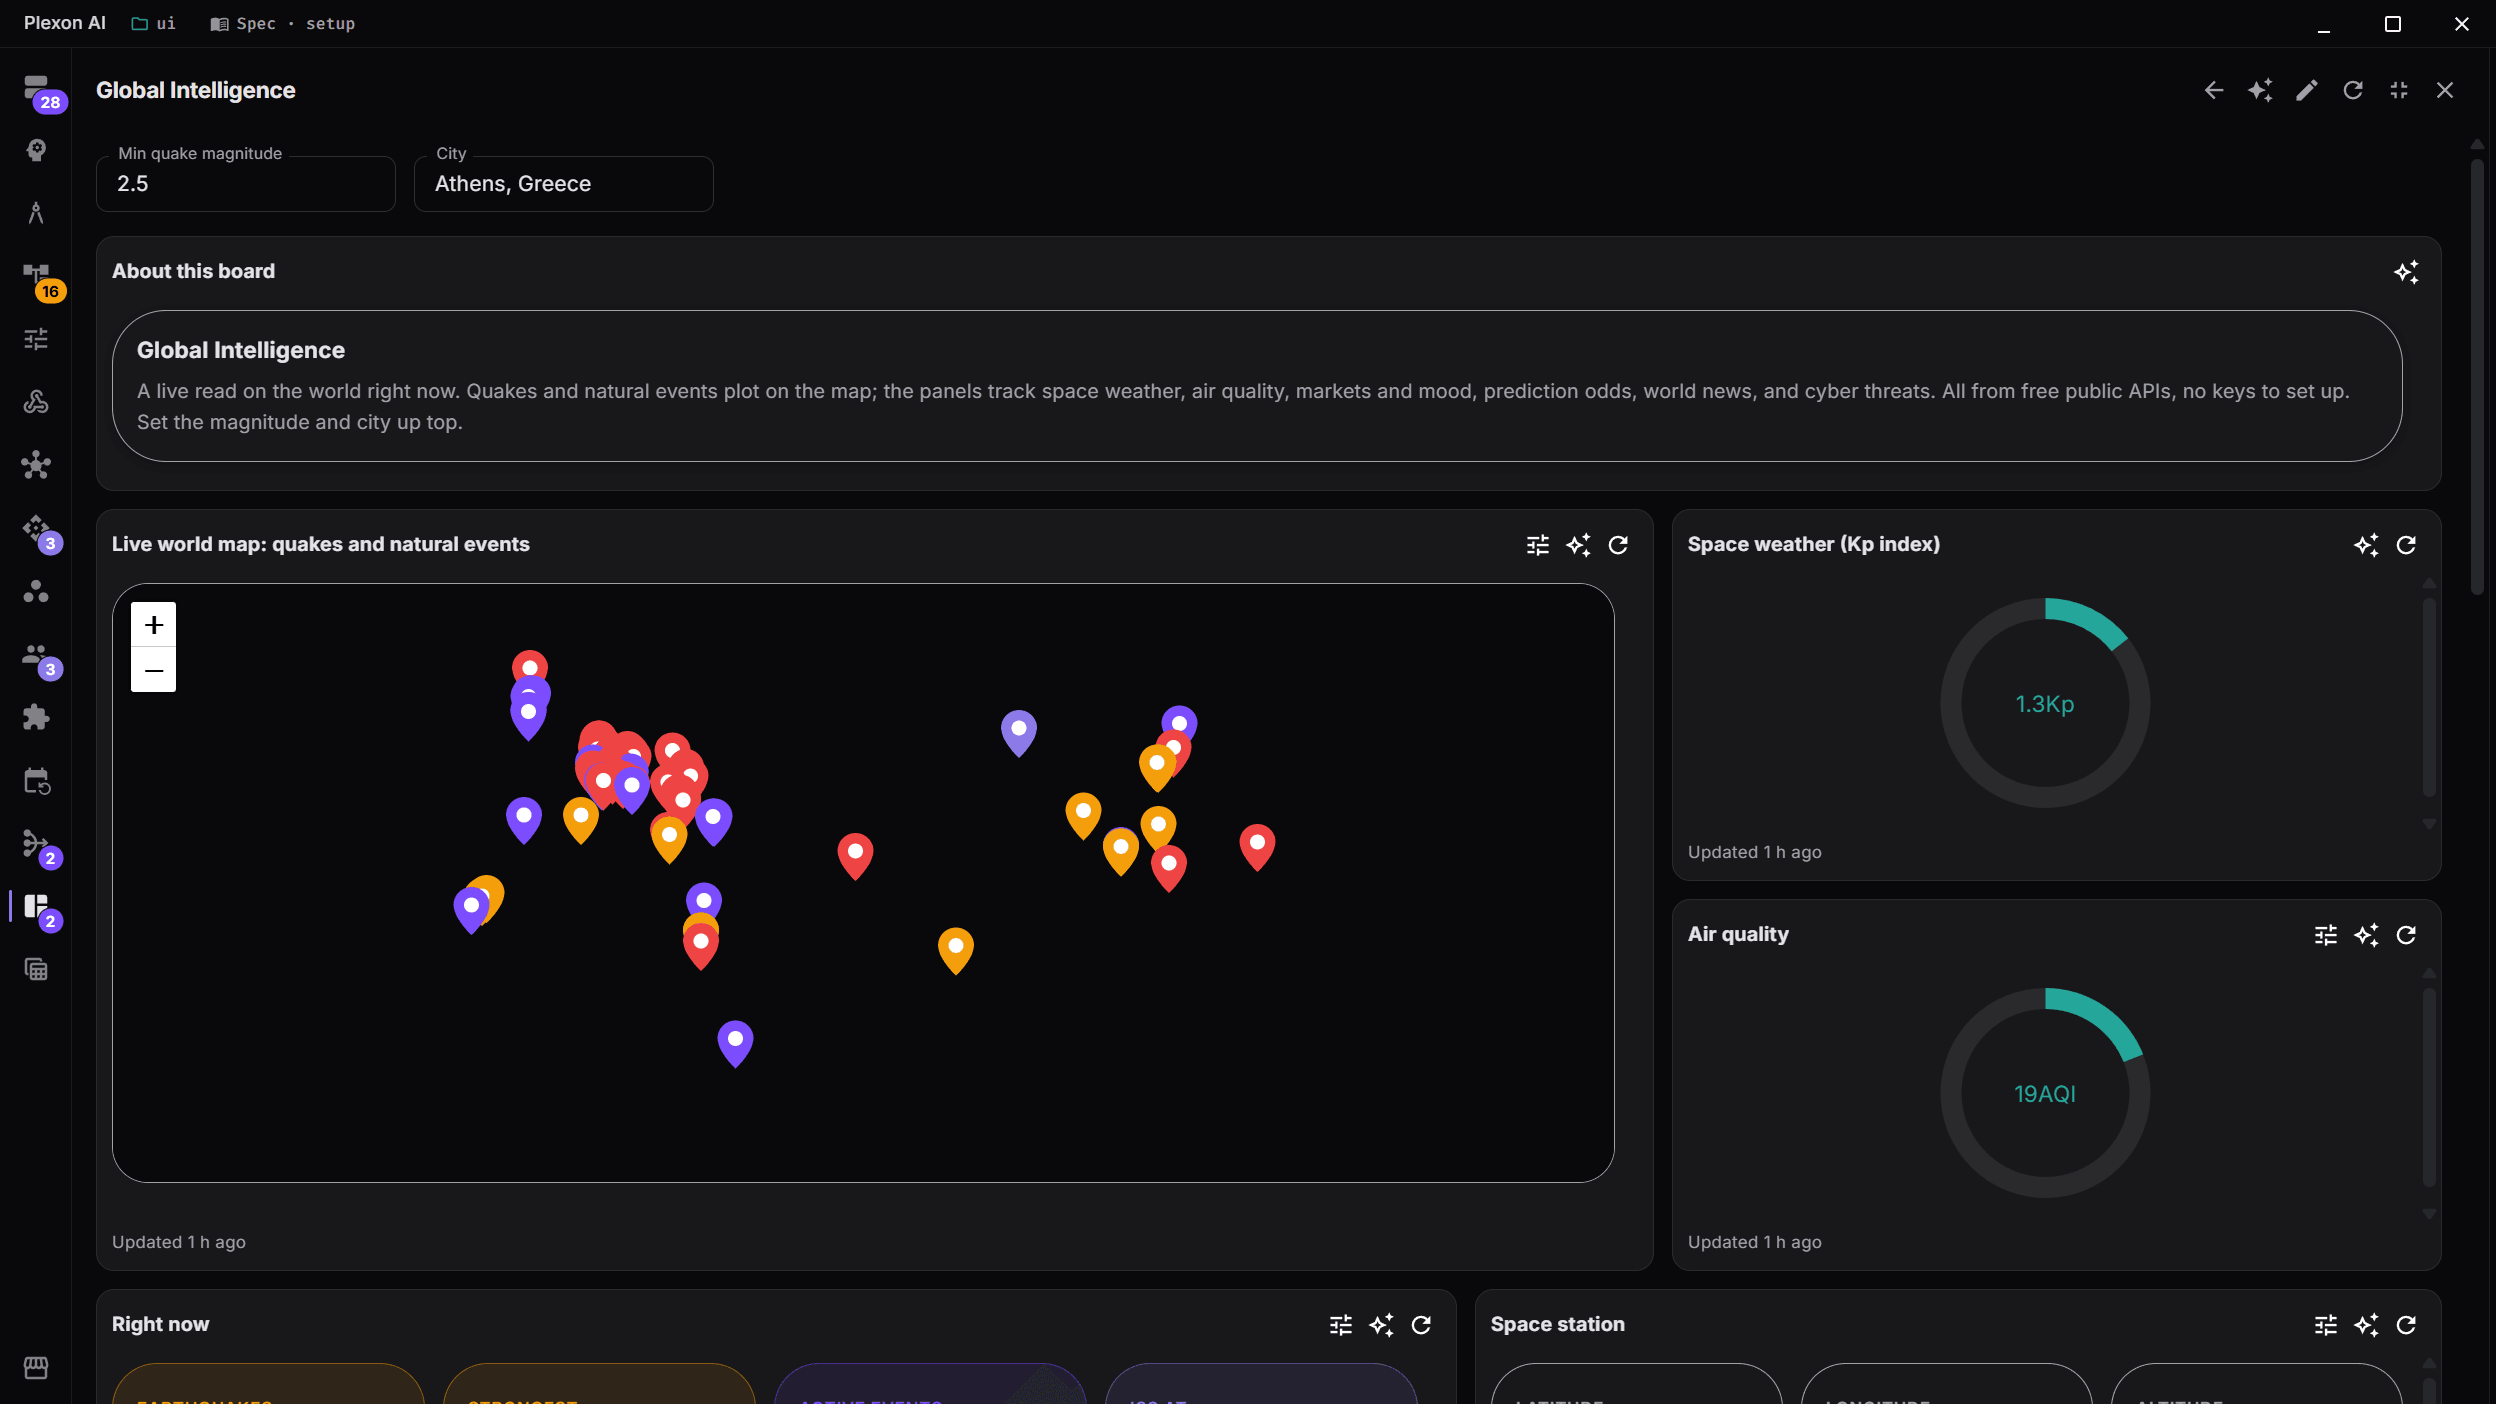
A board of live widgets
Open a board and read it at a glance. Each widget fetches its own data and stamps the moment it last refreshed. The Global Intelligence board here plots quakes and natural events on a world map, then tracks space weather, air quality, markets, world news, and more, all from free public APIs with no keys to set up.
- Stat tiles, line, bar, pie, and area charts, gauges, status pills, and tables
- A table row can carry a button that runs a tool on that record. A mapping editor shows which fields feed the call, and a confirm step sits between the click and the run, so a board of work to get through is also where you tick it off
- Long values stay readable: a cell shows two lines, the whole thing on hover, and opens in place when you click it. A cell holding a file opens that file or its folder
- Each widget shows when it last refreshed
- Maximize any widget to fill the screen
- A dark surface that matches the rest of Plexon
Point a widget at any source
Select a widget and wire it up in the side panel. Read from a connector or a built-in tool, an AI query, a workflow’s output, plain static text, or another widget already on the board. A tool call spends zero AI tokens. Static content fills in as typed fields, one per prop, so the shape is never something you have to know by heart. Set how often it refreshes, one widget at a time, in plain language rather than raw seconds.
- Data from a tool, the AI, a workflow, static text, or another widget already on the board, each explained where you pick it
- Point a widget at another widget’s data and one fetch feeds both: the dependent follows the source’s own refresh instead of running its own
- Static content as fields: a tile’s label and value, a chart’s series, a table’s rows. Fill with example writes a starting set you can edit or clear
- JSON stays one click away. An issues chip flags what’s wrong in plain language as you type, with a Fix button when Plexon knows what you meant
- Describe what an AI widget should show and skip the schema: the output shape comes from the widget type itself. Run it once to preview before it goes live, with a budget chip keeping spend in view
- Options for height, tone, donut, and language, whatever the data source is
- Board parameters fold into tool arguments and static values
- A field that wants a path into your data lists the paths it actually has, each with what it holds
- Chart values are chips: paste a column from a spreadsheet and it splits into one per value
- Refresh in plain language: Manual, Every 15 minutes, Hourly, or Daily, per widget, each saying what it means
- The Source list explains every kind, including which one spends money, and a cost cap shows what it comes to per day at the cadence you picked
- A tool’s settings carry plain names, examples you can click, dropdowns in words, and a Browse button for files and folders. The options nobody needs fold away
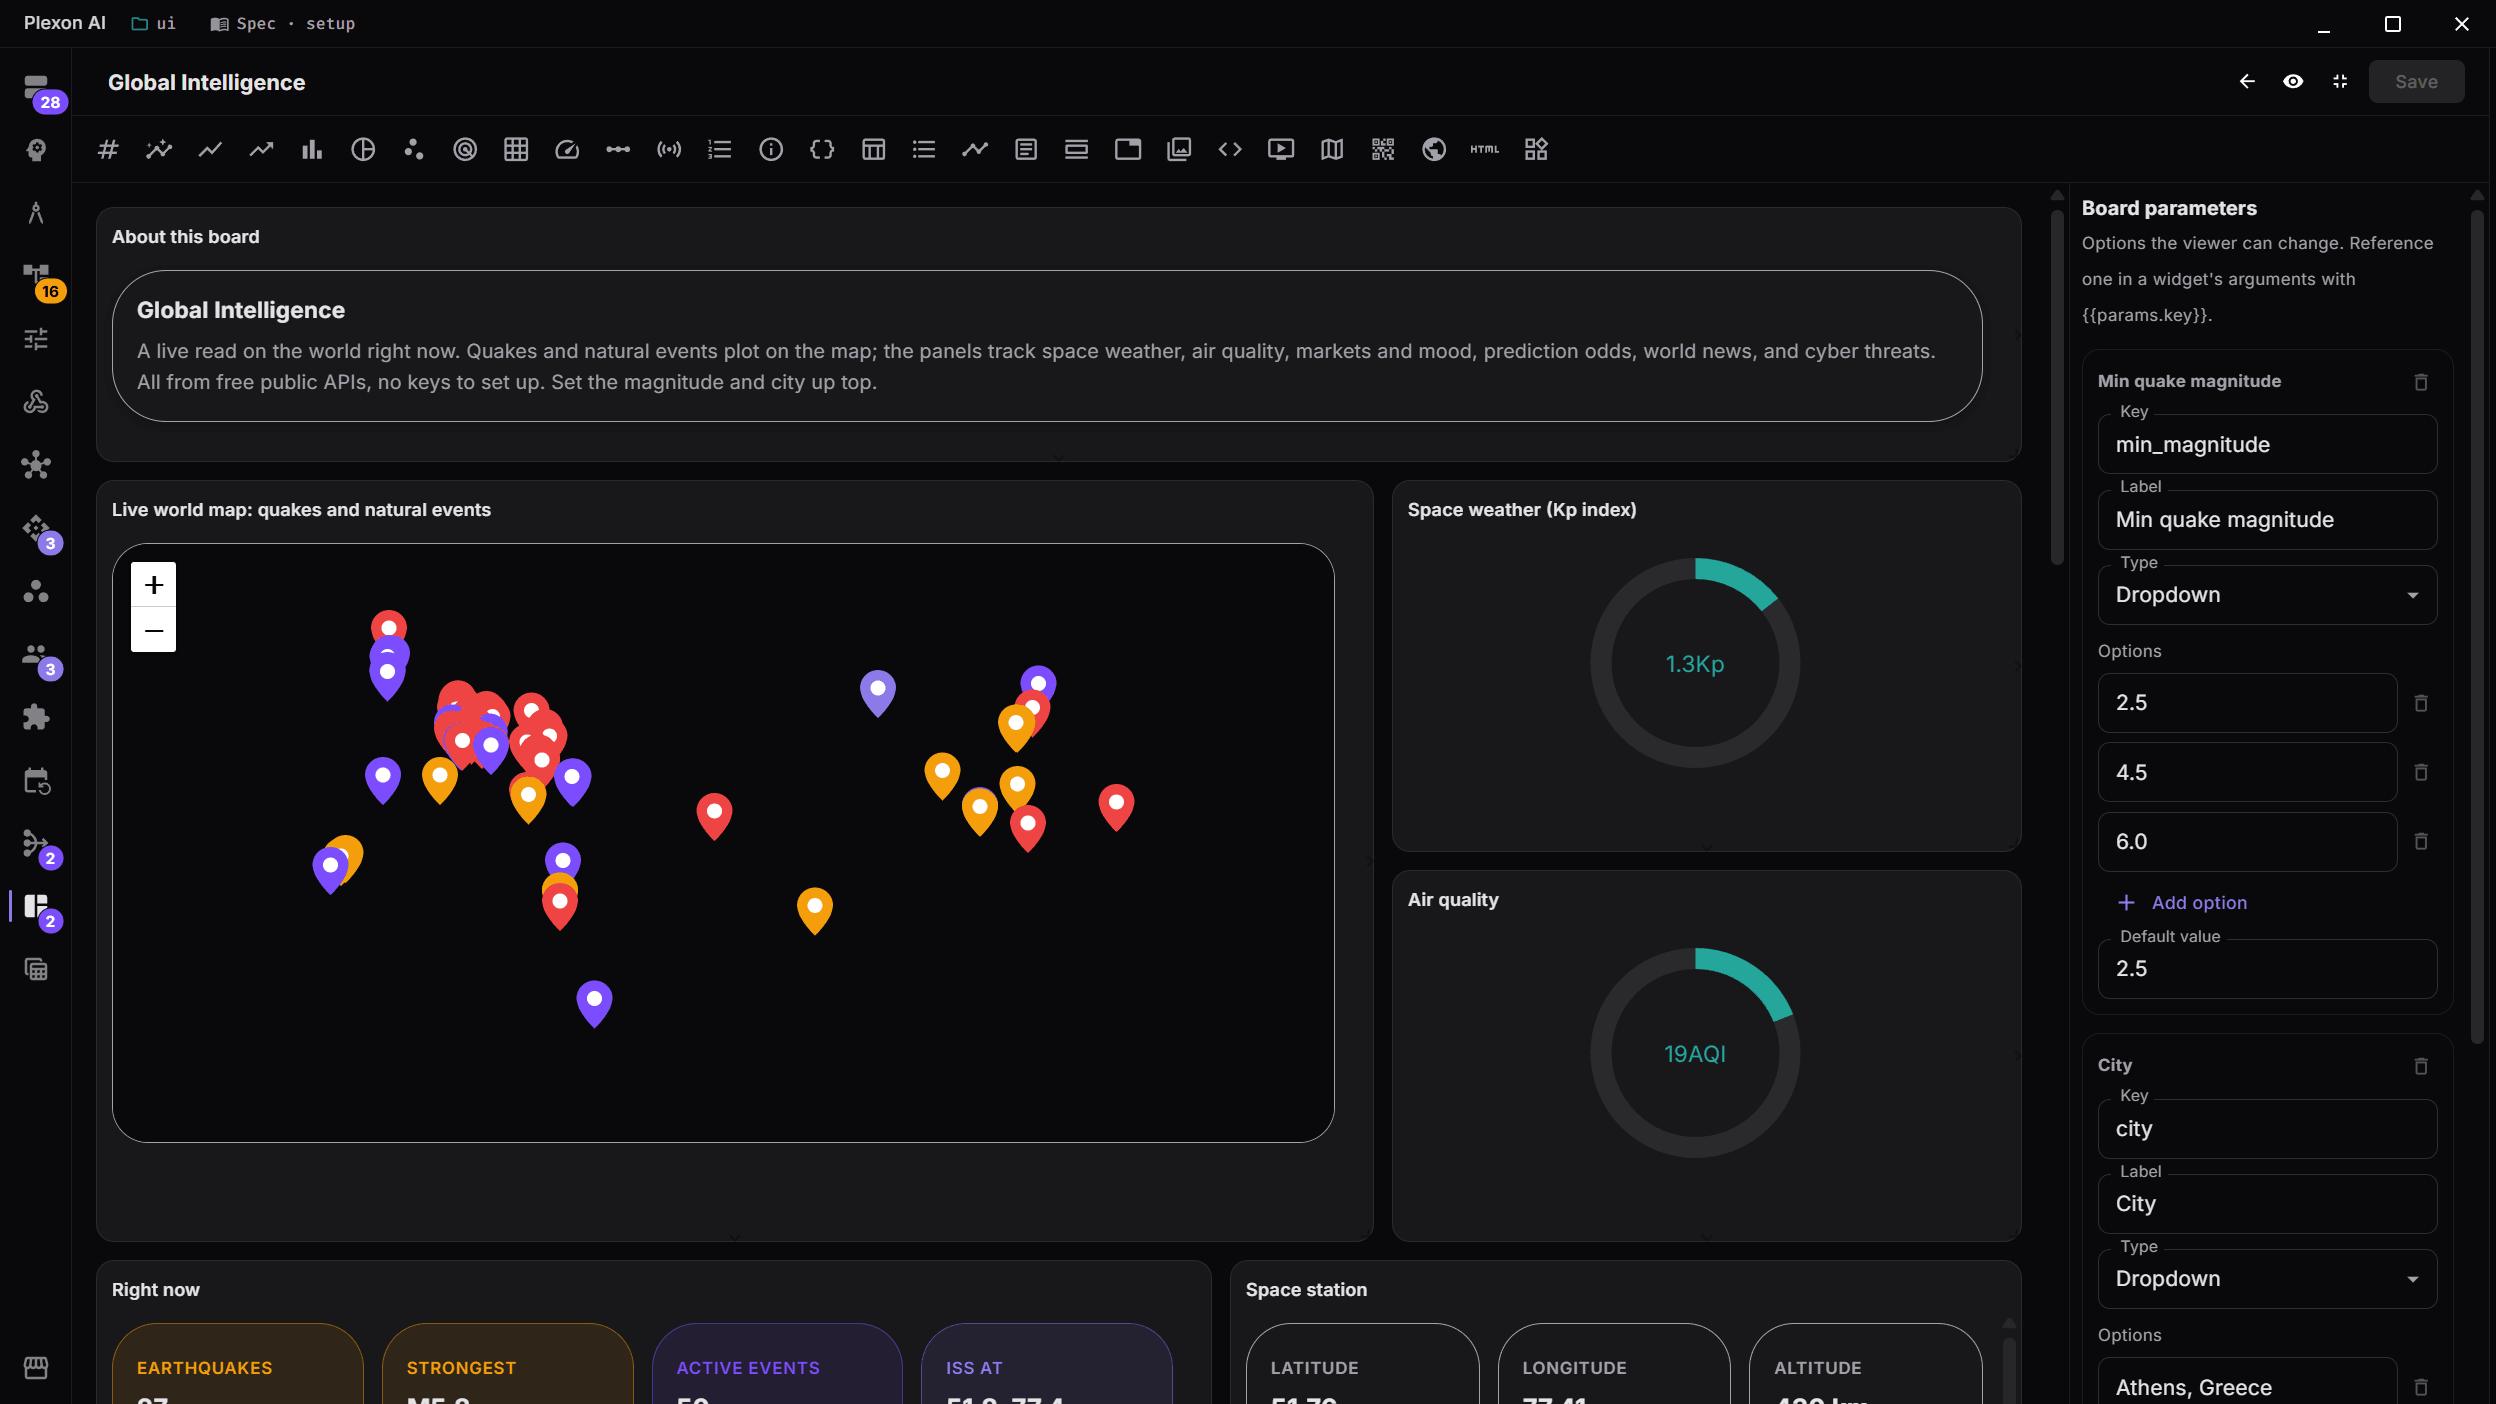
Arrange it on the editor
Drag, drop, and resize widgets on a grid. Add a board parameter, like a city, and every widget that reads it re-runs the moment you change it. Add a widget from a palette of task-first recipes, like Track a stock, Weather now, or Rows from a data source, each one wired to real data already. The full widget catalog sits one tab over, under All widget types.
- Drag-and-drop grid with resize handles
- Board parameters feed tool arguments, AI prompts, and static text through {{ params }}
- One City dropdown swaps the data across the whole board
- A task-first palette leads with recipes like Track a stock, Weather now, and Rows from a data source, each one wired to working data from the start
- App feeds land as widgets from the same palette: latest WhatsApp messages, unread email, recent Drive files, your open Jira tickets, open pull requests, and more
- The full widget catalog sits under All widget types
One New dashboard button, three ways to start
New dashboard opens three doors: describe the board you want and the AI drafts it, copy one of your own boards as a template, or start from an empty grid. Either way, an AI panel docks beside the grid: ask for a change on one widget or the whole board and watch it update as each save lands.
- New dashboard opens three doors: describe it in chat, copy a board you already have, or start blank
- Edit with AI beside the board, on one widget or the whole grid
- The board updates live as the AI saves
- Your data sources and layout survive the edit
HTML widgets you edit like a web page
Drop in an HTML widget and build whatever a browser can render. Edit it the same way you edit a page in the embedded browser: point at an element, say what to change. A multi-file widget gets its own sandbox and origin.
- A single file, or a multi-file project per widget
- Live data arrives over a small bridge, no CORS to fight
- fetch() reaches real endpoints through the host
- Inspect an element and edit it with AI
Keep boards fresh in the background
Turn on monitoring and a board keeps refreshing even when it is closed. Free tool and data calls refresh on their own. Anything that costs money waits for you to opt in, with an interval and a budget.
- Background refresh on a timer, per board
- Free tool and data refreshes run on their own
- AI and paid refreshes are opt-in, with a budget
- A board pauses itself rather than overspend
Or just ask
Describe the board and it builds it
You do not have to place a single widget. Say what you want to see and Plexon drafts the board, wired to your tools, for you to check over. Building one by hand is still there when you want the control.
Say this
A morning board for my city: the weather right now, the euro exchange rates, and the air quality.
You get back
A board with three panels, already reading live data and already labelled. The weather comes back as a row of numbers you can read at a glance, the rates as a small table, the air quality as a dial.
Say this
Put my open orders on a board, newest first, and a big number for how many are unshipped.
You get back
A table of orders next to a single large figure. Both point at the same connected app, so the number and the list can never disagree with each other.
Say this
Show me this spreadsheet as a board: one number per column total, and the rows underneath.
You get back
The file you imported, read straight onto the board. Totals across the top, the rows below, and nothing retyped.
Say this
A board that shows what my nightly check found the last time it ran.
You get back
Panels fed by that job’s most recent run rather than by a fresh lookup, so opening the board costs nothing and shows exactly what the job saw.
Every draft opens for you to read before it does anything. Nothing runs, sends, or refreshes until you have looked at the board and said so.
The bundled example: a Weather & City board
A board that fills itself in the moment you open it.
Plexon ships one board so a real dashboard is there to open and read. It pulls live weather, air quality, local time, a seven-day forecast, and exchange rates from free built-in tools, no API key to set up. A City dropdown at the top swaps every widget at once.
It starts inactive and fills in the moment you open it. Switch on monitoring to keep it refreshing in the background, and the same widgets are yours to rearrange, retune, or point somewhere new.
What’s on the board
- Current conditions, temperature, humidity, and wind
- Air quality as a gauge
- A seven-day forecast as an area chart
- Local time, sunrise, and sunset
- Exchange rates as a table
Why it’s a good first board
- Free tools, no keys to wire up
- One City parameter drives everything
- Tiles, charts, a gauge, and a table in one place
- Safe to edit, duplicate, or rebuild
Free built-in weather, air-quality, and currency tools feed this board, so it works the moment you open it, with no connector to set up.
Also bundled: a Global Intelligence board
A live read on the world, from free public data.
Open the Global Intelligence board for a real-time picture of the planet. A world map plots recent earthquakes and natural events, and the panels around it track space weather, air quality, crypto and market mood, prediction-market odds, world headlines, fresh cyber threats, and cloud-service status. Every source is a free public API with no key to set up.
Pick a minimum quake magnitude and a city up top. Optional flight, wildfire, and air-quality-station layers stay hidden until you add a free account key. Like every board, it starts inactive and fills in the moment you open it.
What’s on the board
- A world map of recent earthquakes and natural events
- Space weather and air quality as gauges
- Top crypto with a Fear and Greed gauge
- Prediction-market odds and world headlines
- Fresh botnet servers and cloud-service status
Why it reads well at a glance
- Free public data, no keys to wire up
- One shared call feeds the map and its panels
- Optional flight and wildfire layers when you add a free key
- A situational board you can reshape
Data from USGS, NASA, NOAA, Open-Meteo, CoinGecko, Polymarket, public news feeds, and abuse.ch. All free, all keyless.
Boards that keep up
Live by default
Widgets refresh on their own timer, in front of you or quietly in the background.
Any data source
A tool, the AI, a workflow, static text, or another widget on the board. Connector calls cost zero AI tokens.
HTML widgets
Build a widget as a web page and edit it with AI, one element at a time.
Yours to share
Attach a board to a persona or bundle it into a marketplace, like agents and skills.
Connects to
Nothing here works alone. See the whole map for how the pieces fit together.
This one is taught in step 6 of 8: make the result visible.
What feeds it
App Connectors feeds this.
A widget's data can come from a connector tool call, refreshed on a timer.
API Connections feeds this.
Any imported endpoint can be a widget source.
Data Sources feeds this.
Bind a widget to a source and a field, with no JSON.
AI Chat & Modes authors this.
Draft a board in chat, then keep editing it by describing the change.
Decision Tools feeds this.
Bindable, so a board can carry a cash fan chart built on the runway model.
Dynamic Workflows renders into this.
A widget bound to a workflow shows the output of its most recent run, so opening the board does not re-run anything.
Where it goes
This is packaged by Personas.
A persona ships its board: the Trader Cockpit, the Founder Cockpit, Greek Tax & Compliance.
This is distributed by Unified Marketplace.
Boards travel inside a marketplace bundle.
This feeds Action Record & Tool Rules.
A widget's tool call lands in the record with the dashboard named as the one that started it.